by Diana Southall | Feb 3, 2020 | Execution, ScalingUp, strategy
Many companies flat-line after a growth spurt, as the organization, faces new issues to handle the increased customers and orders and complexity.
To explain why this happens, I have included part of an article that appeared on the Growth Institute Blog– “4 Stages of Growth.”
Most businesses stay at Stage 1 or get stuck at Stage 2– less than 10% make the leap into Stage 3 [where the owner has sustainable financial value and freedom].
This is a good outline to see where you should focus your attention and invest your time and money:
4 Stages of Growth, by Daniel Marcos [Growth Institute Blog]
The four stages are a roadmap that guides how your focus, priorities, and key decisions will change as your company grows. The roadmap will prepare you for the barriers you will face and the new skills you need to develop to overcome them.
Here is an overview of the four stages of scaling up:
- Startup: 1-5 employees
- Grow up: 6-15 employees
- Scale-up: 16-250 employees
- Dominate your industry: 250+ employees
The Dynamic Growth Model
For a company to scale to $5, 10, or even 100 million in revenue, you need to understand what to expect at the four stages of scaling up, and how to shift gears from one stage to the next.
Shifting through these four stages is what we call the dynamic growth model. Let’s now look into each stage of the dynamic growth model so you understand the priorities and barriers of each stage, plus the key decisions you need to make to go to the next stage. [To read about all the stages see the full blog here].
Stage 2: Grow up:
At this stage, you have grown to 6-15 employees. You have fixed expenses such as salaries and rent. This is a discovery stage where an entrepreneur ages the most. It’s the most painful stage because you begin to face a lot of cash flow problems and leadership problems.
Focus: 100% of sales.
Priority: Hire the right team.
In Stage 1, you don’t really choose your employees because you are not able to offer an attractive salary or attract people with a good brand. So at Stage 2, your employees actually choose you.
By the time you reach Stage 2, you need to switch gears. Now, you are choosing your employees. You have to be more selective of who you hire, and have clarity of their role.
Barrier: Leadership.
In Stage 1, the entrepreneur wears multiple hats — from administration to technical work, accounting and more. At Stage 2, you have to become a leader.
Ability: Delegate, predict, repetitiveness
As a leader, you now need to know how to delegate, set up systems and procedures, and leading your team to help you grow the company.
Decisions: Cash and team.
As mentioned earlier, this is the stage you begin to face cash flow procedures now that you have fixed expenses. Thus, your key decisions will revolve around managing cash flow and hiring the right people who can grow your business.
Note how Daniel points “it’s the most painful stage” and yet so many businesses get stuck here– causing that hamster-wheel feeling for owners who are frustrated that growth hasn’t led to a better team, a well-oiled machine, higher profits or less stress and time off.
You can stay at Stage 2 with a smaller team, but evolve to a professionally run and super-profitable business– it’s all about the focus and decisions [people + process].

by Diana Southall | Jan 3, 2020 | dashboards, Execution
According to W. Edwards Deming, “the fundamental job of a leader is prediction.”
To do this, you need data— the right data presented in the right way so you can make the right decisions.
Mid-sized and large corporations are hiring and training an army of “business intelligence” analysts so that they can capture, analyze, evaluate and leverage all sorts of data to do a better job at sales, marketing, customer service, creating the best team, and increasing profits.
And they will use this information to target your customers and gain market share.
Facebook Google and Amazon and Netflix and Youtube know more about us that some of our friends and they are using it to sell us more products and services.
But all is not lost– your business can do the same even without the same volume of data and spending millions on fancy math majors and software.
I suggest that a place to start is to implement four “Rockefeller Habits”:
Rockefeller Habit #5. Gather Employee Input
Rockefeller Habit #6. Gather Customer Input
- These should be regular parts of your intelligence gathering, topics for discussion at your weekly management meeting, and inputs for your quarterly and annual planning cycle.
- Customer and employee data provide insights about what your company does well, needs to improve, and opportunities to provide something your competitors do not [for a competitive advantage]
The next Rockefeller Habit that is relevant to your data gathering is:
#9. Key Performance Indicators KPI for Everyone
- Employees want to know “did I have a great day or week?”- having a clear and simple KPI can let them know this and keep their focus and efforts aligned with department and company goals.
Lastly, if every department and individual has the right KPI for your business, the most beneficial way to use all this data to evaluate, motivate and re-prioritize is to implement:
Rockefeller Habit #10. Scoreboards Everywhere [see below for last week’s email “8 Benefits of a Dashboard for your Business.”
- These Habits are part of an “Accountability Management System”– where you have a single place to capture, track, review, evaluate, and use all your Data for strategic thinking and implementation planning.
It may sound a bit daunting, but we have seen clients develop their KPI and dashboards in about 3 months, and then build the habits to incorporate into their “execution rhythm” in another 3 months [or sooner.]
Flying with instruments calibrated to your journey is definitively more effective than flying blind.
Resources
Click here to download your own copy of the 10 Rockefeller Habits, the foundation of the Scaling Up process to align People + Process to Strategy, for a more competitive customer experience.

by Diana Southall | Dec 8, 2019 | dashboards, Execution, ScalingUp
I had lunch yesterday with my now-retired business partner and mentor, Dr. Jerry Newman.
Since 1977 he has been teaching CEO’s and business managers that their
People systems and Pay need to align with business goals, and that all should be objectively measured.
You know, since Jimmy Carter was President… I was wearing polyester striped bell-bottoms, and during the stagflation years before Reagan and the economic growth of 1981-2008 and 2016 until now.
Not new news, people!
I also just read “Measure What Matters” by John Doerr- who worked with Google and Intel and the Gates Foundation to do just that.
Here is are some excerpts– I recommend you read the whole book!
Summary of Measure What Matters — the OKR Framework
Objectives (Os)
• Simply WHAT is to be achieved
• Significant, concrete and action oriented
• They are a vaccine against fuzzy thinking
• The objective is the direction
Key Results (KRs)
• They benchmark and monitor HOW we get to the objective
• KR should be succinct, specific, and measurable
• The KRs typically include hard numbers
They are expressed in this format:
We Want to:
• {Objective}
As measured by this set of KRs:
• {1. Key Result}
• {2. Key Result}
• {3. Key Result}
One of the most sought benefits of implementing an OKR [Objectives and Key Results] strategy is corporate alignment.
Four benefits of the OKR system: Focus, Alignment, Tracking and Stretch, were used by DR Andy Grove when he was CEO of Intel to return to its “rightful, dominant market position.”
- Superpower #1: Focus and Commit to Priorities
- Superpower #2: Align and Connect for Teamwork
- Superpower #3: Track for Accountability
- Superpower #4: Stretch for Amazing
The New World of Work
- Continuous Performance Management
- Culture -Conversations, Feedback and Recognition that supports your ideal culture
Some of my favorite excerpts:
“We don’t hire smart people to tell them what to do. We hire smart people so they can tell us what to do.” — Steve Jobs
Getting the entire organization focused on the company’s most crucial Objectives is key to employee engagement and ultimately success in the market.
Studies suggest that only seven percent of employees genuinely understand their company’s strategies, and, what’s expected of them to help reach these corporate objectives.
What is the connective tissue that enables this alignment? OKRs, (Objectives and Key Results) can provide the linkage and visibility to create true alignment in any organization.
Doerr uses a football team analogy to illustrate why connecting Objectives is a blend of top-down and bottom-up planning. Setting successful OKRs requires a balance of cascading Objectives and Key Results down through the organization, and input from employees into their personal Objectives. (With the important caveat that personal Objectives must be in support of, connected to, the company’s top priorities).
The top-down cascading connects everyone in the organization, creating alignment; and the bottom-up planning gives individuals a greater sense of ownership, creating engagement.
Doerr quotes an exasperated CEO who states, “At any given time, some significant percentage of our people are working on the wrong thing. The challenge is knowing which ones!”
“Ideas are easy, execution is everything.”

by Diana Southall | Sep 5, 2019 | dashboards, Execution, strategy
I have an important question for you …
How is your business doing? Can you tell me if you are having a “good” year or a “bad” year?
If you can only check your bank balance or ask your accountant, you are flying blind… this is not enough information to make good decisions and evaluate what is working and what to change.
You may have heard of “Key Performance Indicators” or metrics, so let me tell you why I highly recommend that every business track these on a simple one-page document called a “dashboard.”
8 Benefits of a Dashboard for Your Business
1. Visibility: The new field of “Business Intelligence” or BI shows that the more you measure in your business the more you can improve. What is measured becomes a higher priority and gives you a tangible target to improve.
2. Maintain quality during growth: If your business is growing, you need to make sure that you are maintaining the quality and customer experience standards and your team are not burning out.
3. Alerts before systems break: When you track leading indicators, you can see issues coming before they happen. For example, if you track pending orders you might see that your current production schedule can’t handle the order volume and will be backlogged by two weeks. Dashboards can alert you to this before chaos ensues.
4. Less stress: When you have a dashboard, you can get timely and accurate data on your business health, compared to your targeted goals and to historical trends. This will allow owners and general managers to feel more comfortable letting go of responsibilities while knowing they are “watching the store” and things are running smoothly.
5. The basis for accountability: How do you know your managers are doing their job? Easy, just check their department dashboards. Where do they need more coaching? — you will see a lack of improvement or a drop in their key numbers to let you know there is an area to discuss and determine the root cause. This ongoing process improvement conversation increases the business knowledge and the decision-making competencies of your managers.
6. Data to make/evaluate decisions: Did that marketing campaign or new training program yield positive business results? If you see improvement in your dashboard numbers, you can see if a project was successful.
7. Creates ownership thinking and alignment: This is especially true when business dashboard metrics “cascade” down to departments and to individuals. Employees and managers start to understand what they can do to increase revenue and customer service and efficiency or reduce costs.
8. Improves revenue, productivity, margins, profits, and teamwork. As you can see from the list above, focus and clarity around what is important to drive business value and improve your value to customers will only improve your financial results and operational capacity.
These are not just a “report card” or your income statement from last month– they are far more powerful as they look under the hood at the engine and other moving parts of your business.
Implementing dashboards and management review and planning around the data can be the foundation of high functioning, profitable and growing organization.
“That which is measured improves. That which is measured and reported improves exponentially.” Karl Pearson
If you want to find out how dashboards can be the foundation of your business management and team coaching, you can read the rest of the process in my Guide to Coach Your Team for Accountability & Performance.
Download here: “Guide to Coaching for Accountability & Performance”

by Diana Southall | Aug 8, 2019 | action plans, Execution, planning, ScalingUp, strategy
“More companies die from indigestion than starvation.” – Dave Packard, Hewlett Packard
You might be surprised to know that I speak to business owners every month who want to grow 25% next year, but they don’t have a plan to get the sales or handle the extra work.
According to Scaling Up by Verne Harnish, these are 3 warning signs that you aren’t ready for more sales:
- Your profits are at or below the industry average [or you don’t know what that is]
- Processes are not running smoothly now
- There is drama on the team or from customers from missed deadlines, increasing mistakes, lack of resources, and “communication” issues
- People are working overtime to fix problems
At the very time when the focus becomes more important, your key people start being “too busy” putting out fires to work “on” the business.
Maybe you are doing this too— getting dragged into daily work instead of setting aside time to evaluate, plan and work on the key projects that will improve the business.
What is the solution?
Thousands of businesses have adopted the “10 Rockefeller Habits” as outlined in Vernes’ book “Mastering the Rockefeller Habits” (and now updated in his recent book, Scaling Up.)

by Diana Southall | Jun 1, 2018 | accountability, action plans, Execution, performance, planning
Is it time to focus and finish your projects for this quarter?
Before you answer, click here to read my article from two weeks ago– “Why Aren’t You Finishing Projects (Part 1).”
Here are my thoughts on “Why Aren’t You Finishing Projects – Part 2”:
The main answer is that you are juggling TOO MANY projects.
Below is my graphic explaining another concept from Todd Herman.
This example shows what happens if you juggle 5 projects, versus tackling one at a time:
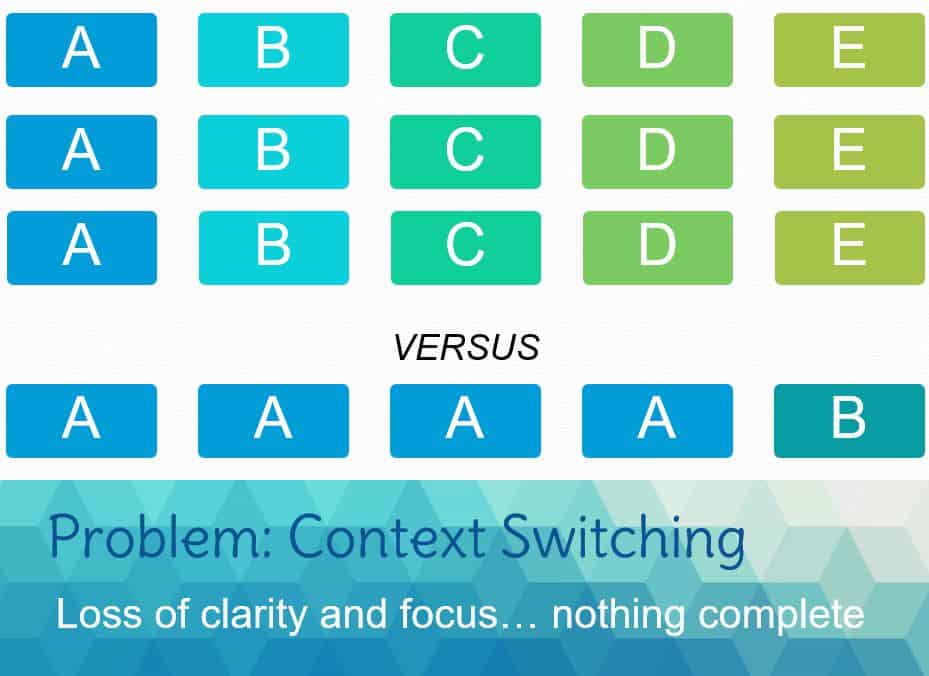
This shows you the impact of “context switching”– when your brain and effort is spread across multiple things.
As Todd explains it, if it takes 4 hours to finish one project, and you do one hour a week on 5 project at a time, it takes you 16 weeks to finish Project A.
If you work on only Project A, you are finished in 4 weeks.
Now I realize that some projects take more time and require waiting on other people, but I think the concept is pretty clear.
One finished and implemented project is worth 50 started and abandoned ones.
If you need a bit of inspiration/ motivation to keep plugging on Project A, re-read the article PART 1.
So pick one half-finished project and make a commitment to power through and “get ‘r’ done” by the end of the 13-week quarter.
Image from Todd Herman