by Diana Southall | Feb 3, 2020 | Execution, ScalingUp, strategy
Many companies flat-line after a growth spurt, as the organization, faces new issues to handle the increased customers and orders and complexity.
To explain why this happens, I have included part of an article that appeared on the Growth Institute Blog– “4 Stages of Growth.”
Most businesses stay at Stage 1 or get stuck at Stage 2– less than 10% make the leap into Stage 3 [where the owner has sustainable financial value and freedom].
This is a good outline to see where you should focus your attention and invest your time and money:
4 Stages of Growth, by Daniel Marcos [Growth Institute Blog]
The four stages are a roadmap that guides how your focus, priorities, and key decisions will change as your company grows. The roadmap will prepare you for the barriers you will face and the new skills you need to develop to overcome them.
Here is an overview of the four stages of scaling up:
- Startup: 1-5 employees
- Grow up: 6-15 employees
- Scale-up: 16-250 employees
- Dominate your industry: 250+ employees
The Dynamic Growth Model
For a company to scale to $5, 10, or even 100 million in revenue, you need to understand what to expect at the four stages of scaling up, and how to shift gears from one stage to the next.
Shifting through these four stages is what we call the dynamic growth model. Let’s now look into each stage of the dynamic growth model so you understand the priorities and barriers of each stage, plus the key decisions you need to make to go to the next stage. [To read about all the stages see the full blog here].
Stage 2: Grow up:
At this stage, you have grown to 6-15 employees. You have fixed expenses such as salaries and rent. This is a discovery stage where an entrepreneur ages the most. It’s the most painful stage because you begin to face a lot of cash flow problems and leadership problems.
Focus: 100% of sales.
Priority: Hire the right team.
In Stage 1, you don’t really choose your employees because you are not able to offer an attractive salary or attract people with a good brand. So at Stage 2, your employees actually choose you.
By the time you reach Stage 2, you need to switch gears. Now, you are choosing your employees. You have to be more selective of who you hire, and have clarity of their role.
Barrier: Leadership.
In Stage 1, the entrepreneur wears multiple hats — from administration to technical work, accounting and more. At Stage 2, you have to become a leader.
Ability: Delegate, predict, repetitiveness
As a leader, you now need to know how to delegate, set up systems and procedures, and leading your team to help you grow the company.
Decisions: Cash and team.
As mentioned earlier, this is the stage you begin to face cash flow procedures now that you have fixed expenses. Thus, your key decisions will revolve around managing cash flow and hiring the right people who can grow your business.
Note how Daniel points “it’s the most painful stage” and yet so many businesses get stuck here– causing that hamster-wheel feeling for owners who are frustrated that growth hasn’t led to a better team, a well-oiled machine, higher profits or less stress and time off.
You can stay at Stage 2 with a smaller team, but evolve to a professionally run and super-profitable business– it’s all about the focus and decisions [people + process].

by Diana Southall | Jan 15, 2020 | Cash, ScalingUp
Let’s talk about CASH and profits….
Sometimes we think our business finances are linear… if we raise revenues 1% or cut expenses 1% then this will impact our profit 1%.
However, they are not linear.
Did you know that a 1% price increase could increase your profit 3x as much as selling 1% more at the same price?
As part of the “Cash Flow Story” report that we use with customers, you can find out what the “Power of One” will do for your business.
Essentially, the “Power of One” calculates the impact after changes that increase the following items just 1%:
- Price
- Volume
- Cost of Goods Sold (Reduce)
- Accounts Receivable (Reduce)
- Accounts Payable
- Inventory (Turns)
- Overhead Expense (Reduce)
For the sample company “Rebecca’s Coffee” with $6.6 million in revenue, a 1% improvement in those 7 items resulted in a 20% increase in profit…
and cash flow increases from a negative $193,000 (need to borrow) to almost positive cash flow (just reducing AR two more days balances cash flow at zero).
Even though Rebecca’s has $6.6 million in revenue, the current growth from $3.4 million four years ago burned cash and increased debt.
The business is only valued at $207,000– less than 4% of sales!
After the 1% improvement in those 7 elements in the Power of One, the business how has a value of $865,000– a four-fold increase. (Based on a standard multiplier of 4x profits).
You can see the whole sample report here: (Link to Rebecca’s Coffee Cash Flow Story sample report here).
www.cashflowstory.com/dl/rebeccas-coffee-2018.pdf
Fascinating, right?
Of course, with a few strategic changes you can influence the Power of One factors much more than 1%.
For example, after a change in how the contact center handled incoming sales inquiries, one of my clients saw a 37% increase in volume the next month.
Another client changed their scheduling and simplified their production process to handle 40% more volume with the same staff and reduced their cost of materials, so their cost of goods shrunk 10% on the higher sales. They went from zero profits to a decent 10%.
So what is the potential in your business?
If you are curious what is possible to increase your cash flow and profits, just contact me and I would be happy to provide you a custom Cash Flow Story report.

by Diana Southall | Jan 3, 2020 | dashboards, Execution
According to W. Edwards Deming, “the fundamental job of a leader is prediction.”
To do this, you need data— the right data presented in the right way so you can make the right decisions.
Mid-sized and large corporations are hiring and training an army of “business intelligence” analysts so that they can capture, analyze, evaluate and leverage all sorts of data to do a better job at sales, marketing, customer service, creating the best team, and increasing profits.
And they will use this information to target your customers and gain market share.
Facebook Google and Amazon and Netflix and Youtube know more about us that some of our friends and they are using it to sell us more products and services.
But all is not lost– your business can do the same even without the same volume of data and spending millions on fancy math majors and software.
I suggest that a place to start is to implement four “Rockefeller Habits”:
Rockefeller Habit #5. Gather Employee Input
Rockefeller Habit #6. Gather Customer Input
- These should be regular parts of your intelligence gathering, topics for discussion at your weekly management meeting, and inputs for your quarterly and annual planning cycle.
- Customer and employee data provide insights about what your company does well, needs to improve, and opportunities to provide something your competitors do not [for a competitive advantage]
The next Rockefeller Habit that is relevant to your data gathering is:
#9. Key Performance Indicators KPI for Everyone
- Employees want to know “did I have a great day or week?”- having a clear and simple KPI can let them know this and keep their focus and efforts aligned with department and company goals.
Lastly, if every department and individual has the right KPI for your business, the most beneficial way to use all this data to evaluate, motivate and re-prioritize is to implement:
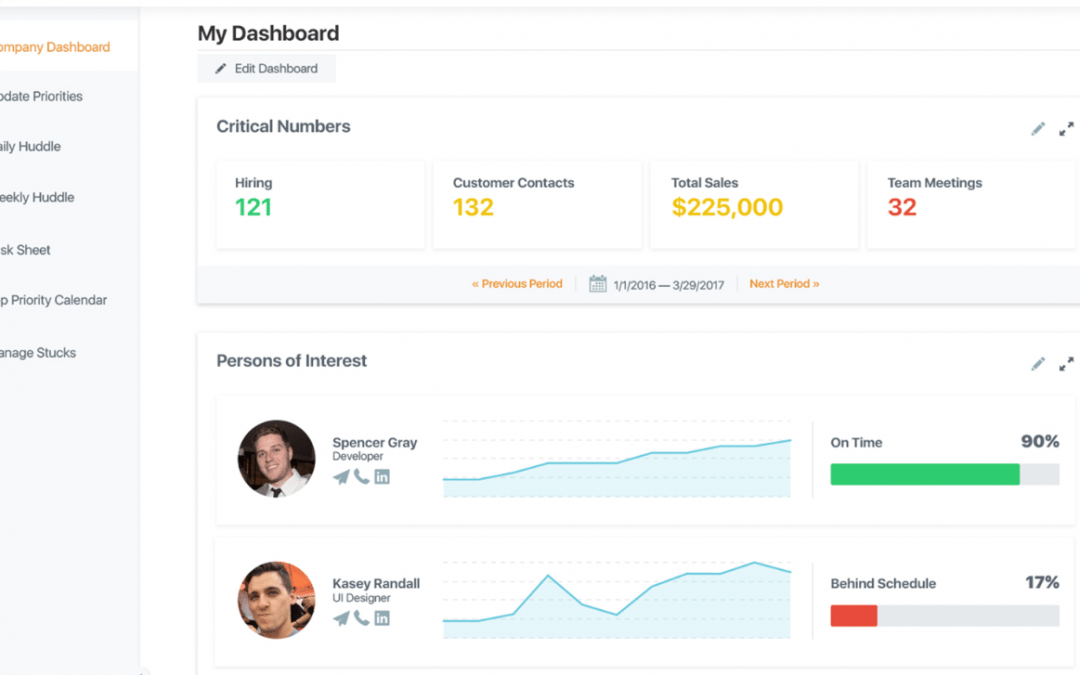
Rockefeller Habit #10. Scoreboards Everywhere [see below for last week’s email “8 Benefits of a Dashboard for your Business.”
- These Habits are part of an “Accountability Management System”– where you have a single place to capture, track, review, evaluate, and use all your Data for strategic thinking and implementation planning.
It may sound a bit daunting, but we have seen clients develop their KPI and dashboards in about 3 months, and then build the habits to incorporate into their “execution rhythm” in another 3 months [or sooner.]
Flying with instruments calibrated to your journey is definitively more effective than flying blind.
Resources
Click here to download your own copy of the 10 Rockefeller Habits, the foundation of the Scaling Up process to align People + Process to Strategy, for a more competitive customer experience.
by Diana Southall | Dec 17, 2019 | accountability, coaching, dashboards, performance
As we look to finish the year strong, today I am talking about report cards.
Kids may not enjoy getting them in school, but as a parent, I find them a valuable tool to monitor progress, compare their results to their peers, get feedback when results are not meeting expectation, and to make changes to our process for homework and studying when there is not an “A.”
Yet once our kids graduate and move to the professional world of work, we forget about this useful tool.
Your business has at least one report card – it’s called an income statement [or P&L].
But does every individual in your organization have their own customized report card?
This article from Entrepreneur Magazine explains why every person should have a scorecard/ dashboard/ report card.
Why Every Employee Needs an Individual Scorecard [by Riaz Khadem, published in Entrepreneur Magazine]
Here is an excerpt:
Why is a scorecard for every person in your organization so important?
Because the scorecard connects individuals to your company’s vision and strategy, and when all the jobholders in a company have a scorecard, the entire company is aligned.
With a scorecard defined clearly in measurable terms, and with specific roles identified, people will be focused on the most important activities. Accountability is clear.
But how does this type of business scorecard compare to the individual scorecards we are describing here? There are several important differences.
Let’s take a look.
- Alignment with vision. The alignment to the mission or vision is usually not clear in business scorecards. They’re very clear in the individual scorecard.
- Progress of strategic initiatives. Strategic initiatives are tracked outside of business scorecards within the individual scorecard because the five indicators in the individual scorecard are usually a mix of visual indicators and strategy indicators.
- Concept of roles for indicators. The concept of roles for the indicators doesn’t exist in business scorecards. It does in the individual scorecard and is there to encourage cross-functional collaboration.
- Related: How to Measure the Effectiveness of Your Company’s Vision
- Information on the scorecard. Business scorecards include aggregate consolidated numbers; the individual scorecards show numbers from the source, where performance takes place.
- A number of factors. Business scorecards can have a large number of indicators; the individual scorecard focuses on a few.
To find out how to cascade your business scorecard down to the individual, read about the process in our “Guide to Coach Your Team for Accountability & Performance.”

by Diana Southall | Dec 8, 2019 | dashboards, Execution, ScalingUp
I had lunch yesterday with my now-retired business partner and mentor, Dr. Jerry Newman.
Since 1977 he has been teaching CEO’s and business managers that their
People systems and Pay need to align with business goals, and that all should be objectively measured.
You know, since Jimmy Carter was President… I was wearing polyester striped bell-bottoms, and during the stagflation years before Reagan and the economic growth of 1981-2008 and 2016 until now.
Not new news, people!
I also just read “Measure What Matters” by John Doerr- who worked with Google and Intel and the Gates Foundation to do just that.
Here is are some excerpts– I recommend you read the whole book!
Summary of Measure What Matters — the OKR Framework
Objectives (Os)
• Simply WHAT is to be achieved
• Significant, concrete and action oriented
• They are a vaccine against fuzzy thinking
• The objective is the direction
Key Results (KRs)
• They benchmark and monitor HOW we get to the objective
• KR should be succinct, specific, and measurable
• The KRs typically include hard numbers
They are expressed in this format:
We Want to:
• {Objective}
As measured by this set of KRs:
• {1. Key Result}
• {2. Key Result}
• {3. Key Result}
One of the most sought benefits of implementing an OKR [Objectives and Key Results] strategy is corporate alignment.
Four benefits of the OKR system: Focus, Alignment, Tracking and Stretch, were used by DR Andy Grove when he was CEO of Intel to return to its “rightful, dominant market position.”
- Superpower #1: Focus and Commit to Priorities
- Superpower #2: Align and Connect for Teamwork
- Superpower #3: Track for Accountability
- Superpower #4: Stretch for Amazing
The New World of Work
- Continuous Performance Management
- Culture -Conversations, Feedback and Recognition that supports your ideal culture
Some of my favorite excerpts:
“We don’t hire smart people to tell them what to do. We hire smart people so they can tell us what to do.” — Steve Jobs
Getting the entire organization focused on the company’s most crucial Objectives is key to employee engagement and ultimately success in the market.
Studies suggest that only seven percent of employees genuinely understand their company’s strategies, and, what’s expected of them to help reach these corporate objectives.
What is the connective tissue that enables this alignment? OKRs, (Objectives and Key Results) can provide the linkage and visibility to create true alignment in any organization.
Doerr uses a football team analogy to illustrate why connecting Objectives is a blend of top-down and bottom-up planning. Setting successful OKRs requires a balance of cascading Objectives and Key Results down through the organization, and input from employees into their personal Objectives. (With the important caveat that personal Objectives must be in support of, connected to, the company’s top priorities).
The top-down cascading connects everyone in the organization, creating alignment; and the bottom-up planning gives individuals a greater sense of ownership, creating engagement.
Doerr quotes an exasperated CEO who states, “At any given time, some significant percentage of our people are working on the wrong thing. The challenge is knowing which ones!”
“Ideas are easy, execution is everything.”